You are here
Using Data to Drive Athletic Success
Sending fans a ticket offer for the game they most want to attend. Athletic trainers measuring an athlete’s biometrics to maximize their on-field performance. Processing on-field stats to guide game strategy. Coaches tracking their budget in real time to help guide spending decisions. That is the reality for professional sports leagues, but just a pipe dream for most collegiate programs.
Pitt is the exception, joining the pro ranks in using data to support administrative, marketing, and eventually athletic operations. The combined forces of Pitt Athletics and Pitt Information Technology are harnessing the power of data to help the Panthers roar louder than ever.
Warm Up
As the then director of business services for Pitt Athletics, Richard Turnquist witnessed the tedious and time-consuming process of using several systems to manually track budgeting and finances via Excel spreadsheets. He approached Ryan Varley, chief financial officer for Athletics, to propose a budgeting dashboard that would update daily, allowing coaches to check current and prior year budgets with ease from any device. The dashboard would pull data directly from various systems to allow staff to make informed and timely decisions. This meant not having to ask the Athletics Business Office to compile reports, which became out of date almost as soon as they were compiled.
Varley was immediately sold on the idea. “Good decisions are based on solid data. Without that, we’re relying on ‘I think, I feel’ assumptions. We need coaches and staff to be able to drill down as granular as specific transactions or as big picture as comparing data year-over-year or between programs to analyze trends and make strategic funding choices,” Varley explains.
Their first task was selling Athletics leadership on the value of the idea. Fortunately, that wasn’t a significant hurdle. Senior leaders understood the power of having better data and were willing to commit the financial and time resources needed to bring it to fruition.
“Pitt Athletics is always looking for opportunities to be an industry leader, and data analytics is the next frontier in nearly all facets of our business. We are incredibly fortunate to have University partners who happen to be the best at what they do in this space. It was a no-brainer to leverage these relationships and resources to collaborate on changing the world right here at Pitt,” says Chris Hoppe, executive associate athletic director for administration.
Game Time
But Turnquist was an army of one, as the only person on the Athletics team with a background in analytics. Varley had heard about the One IT @ Pitt initiative, which encourages departmental IT teams to integrate with Pitt IT. This provides participating departments with customized support, along with access to the enterprise tools and extensive expertise found within the centralized IT function.
Integrating the Athletics IT team with Pitt IT allowed Turnquist to transition to analytics full-time and to have access to a team of experienced data scientists and analytics professionals who could support analytics projects. “Access to the Pitt IT Analytics team was extremely helpful. They were more experienced than I was in some areas, while I had expertise in other facets. By combining resources and expertise in data science and data engineering, we were able to develop a roadmap that set us up for success. I’m not sure we could have done it in a silo,” says Turnquist.
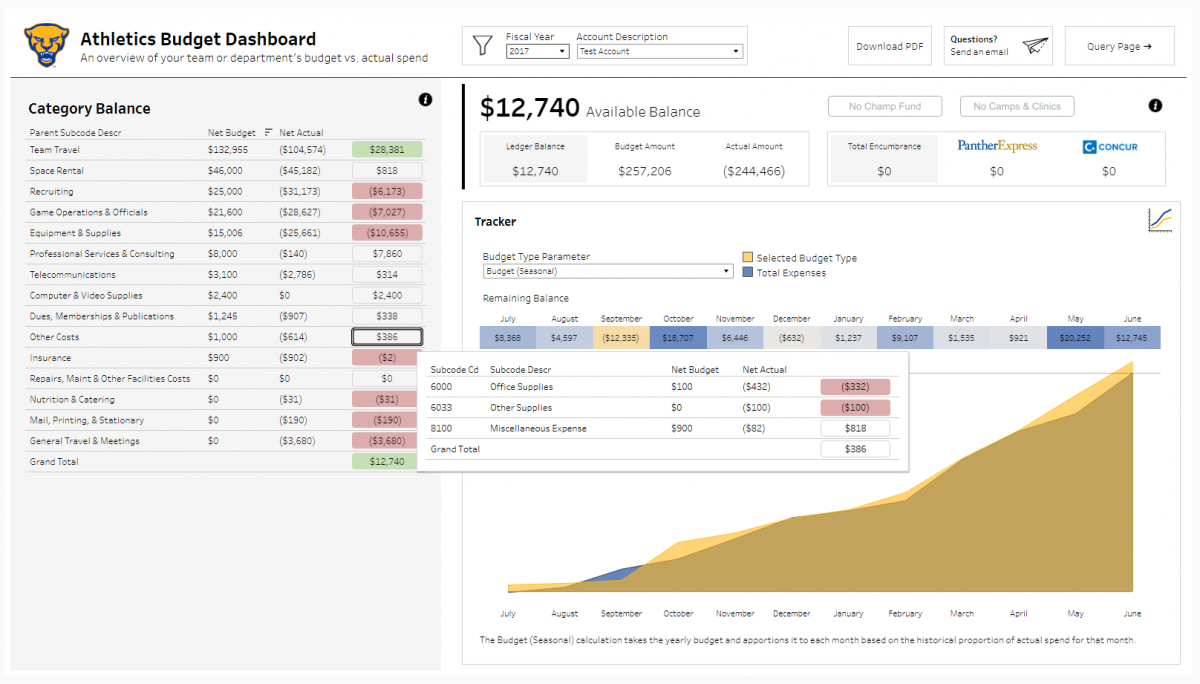
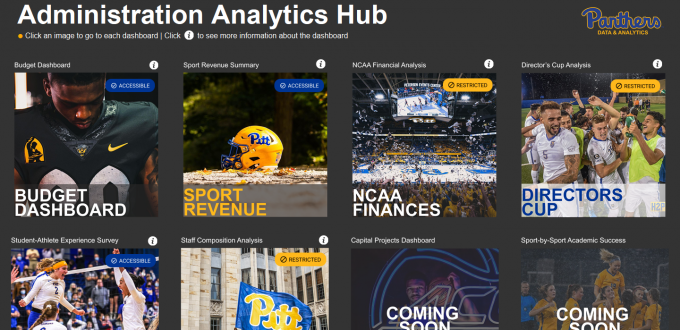
Creating a budgeting tool that could serve each of Pitt’s 19 intercollegiate teams was a huge undertaking. The first year involved extensive development work. In 2018, Turnquist released the Athletics Budget Dashboard, a financial and budgeting tool built in Tableau. It was so effective and easy to use that soon people started submitting requests for even more information to be presented in this format.
Half Time
With the success of the budgeting dashboard, the analytics team moved to develop tools to support revenue generation and marketing efforts by helping them to cater the Panther experience for their fanbase. They are currently finishing a project integrating data from external vendors who provided ticketing, merchandising, facility, and other services, as well internal data to create a 360-degree customer view, a challenge that Athletics has sought to overcome since 2020.
“Before, we could only see our fanbase as a whole. Now, we can better serve our customers by better understanding them. We can identify who is ready for a more premium experience and which fans we are at risk of losing,” Varley explains. For example, a fan who buys ticket to several games every season may be ready to become a season ticket holder, while someone who only follows Panther social media may be interested purchasing new Panther merchandise. They unveiled the Constituent Profile proof of concept in Fall 2021, with full deployment coming this April.
Turnquist and his team are now planning tools that can directly support on-field personnel in achieving athletic success. They are investigating the best ways to facilitate sports analytics, which focuses on leveraging in-game data to adjust game and recruitment strategies, and how to support sports science, which uses biometric data (like heart rate and exertion) to maximize performance through training and lifestyle.
Victory Lap
Turning athletic data into actionable information is a brave new world, especially at the collegiate level. The department took a stepped approach, adding new dashboards as each project proved its worth. “As you prove the value of the concept, you increase buy-in across the department. The value flows downstream; the more we do, the more each team sees the tangible benefits, and they start to ask for even more,” Varley explains.
It's a concept that applies to far more than Athletics, Turnquist notes. “Athletics isn't as unique as people may think. Everyone is looking at how to use data to make more informed choices,” he says. “Departments need to understand the quality of the data they have access to and ways it can be enhanced; explore how data can and should be used to support decision making; and consider ways to automate the gathering and visualization of data to make it usable.” Varley agrees, saying “Departments need to align their data analytics projects with their business objectives,” he says. “Take a multi-year look at where you want to be, align leadership expectations, and build it the right way.”
As fast as technology changes, data is here to stay. With the right people, the right tools, and the right data, you can plan ahead for each new season. To explore how data can help your department up its game, contact Pitt IT Analytics by submitting an IT Service Request.
-- By Vivan Zauhar and Karen Beaudway, Pitt IT Bloggers